Wednesday, March 30, 2011

Theory of Consumption - Indifference Curve Analysis - Substitution Effect


Meaning: When there is a change in the price of one commodity, and when the price of another commodity remains unchanged or constant, the income of the consumer must be changed in such a way that the consumer is neither better off nor worse off. He remains at the same old position. Under that circumstance, if there is a change in the consumption, that would be due to the Substitution Effect.

Equilibrium: We can find out the equilibrium position of the consumer in the following diagram.

In the above diagram AB is the original price or budget line. T is the original equilibrium position. There is a fall in the price of X. So the new budget line is AC. To put the consumer at the same old position we draw another budget or price line DE, which will meet the indifference curve at the point T1. So the movement from T to T1 on the indifference curve IC shows the substitution effect. Here the consumer substitutes n->n1 of Y to get m->m1 more of X because the price of X is now comparatively cheaper than the price of Y.

Monday, March 28, 2011

Factors Governing the Demand of a Commodity

There are several factors which determine the quantity of a commodity that is purchased by a consumer. They are as follows.

1. The price of the commodity: Payment of price involves sacrifice. No reasonable man will sacrifice more than what a thing is worth in terms of utility.
Suppose a man derives a utility worth $40 from a shirt. If the market price of the shirt is more than $40, he will not purchase any. We know that consumers always behave rationally. If the price is $40, he may purchase one. For the second shirt, his utility will be less than $40. He will never purchase two shirts at $40 each. But if the price falls to $30, he may purchase a second shirt. Thus at any particular price, there is a definite quantity of the commodity which the consumer will purchase. The amount of such purchase is determined by the utility received, in comparison with the sacrifice involved. Sacrifice includes sacrifice of liquidity in terms of parting with cash. When the price falls, the sacrifice becomes less, and more will be purchased. When the price rises, the sacrifice increases, and less will be purchased.

2. The income of the consumer: The ability to buy a commodity depends upon the income of the consumer. The higher the income, the less will be the utility derived from the last dollar spent, i.e. less will be the marginal utility of money. A rich man can afford to pay more for what he buys.

When the income of a man increases, his ability to pay increases. He usually buys in large quantities, the goods and services he used to buy formerly, thereby enjoying the economies of scale. He may start buying certain new items. But he may buy less of certain goods when his income increases. He may buy less carbohydrate food and more protein food. The goods which are purchased less when income increases, are called inferior goods.

Decrease in income has the opposite effect. Less goods and services will be purchased. But the purchase of inferior goods may increase.

Thus change in income changes the pattern of consumption, and hence the quality of goods purchased changes.

3. The prices of substitutes and complements: The demand for a commodity changes in the same direction as the price of its substitutes. If the price of coffee falls, the demand for tea will also fall. People will buy more coffee and less tea. This explains the reduced demand for tea.
The demand for a commodity changes in the opposite direction to the prices of its complements. If the prices of computers fall, the demand for internet connections will increase. More people will buy computers, and hence more internet connections will be needed or demanded.

4. The taste and preferences of the consumer: This is the most important factor. How much of a commodity a man buys depends on how intensely he desires it. This also determines how he distributes his income among his different purchases.

5. Habit and imitation: Consumption is determined partly by habit and partly by imitation. A man wants those goods and services with which he has become familiar with long use (i.e. habit). An individual tries to climb upwards in the social scale. He thus always tries or wants to imitate the habits of those people who are socially superior to him. This habit of imitation is called the Demonstration Effect.

A few words about demand schedule: At different prices, the consumer buys different quantities of an article. The demand schedule for a commodity gives different sets of prices at which different amounts of a commodity can be sold. In other words, a list showing the quantities that will be purchased by a consumer at different prices, is called his individual demand schedule.

Just for a change trying to refresh my memory with what I had learnt as a part of my education curriculum during the 80s.

Sunday, March 27, 2011

Indifference Curve Analysis - Price Effect

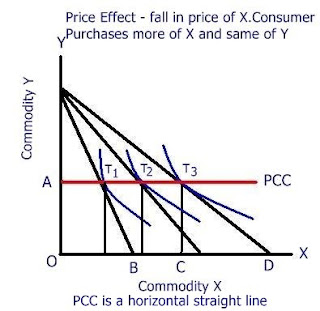
Meaning: When there is no change in the income of the consumer, no change in the price of one commodity, and there is a change in the price of another commodity, there will be a change in the consumption made by the consumer. This change in consumption is known as the Price Effect. Though money income does not increase, the real income increases, generating more purchasing power.

Equilibrium position: Under the Price Effect, there will be a change in the equilibrium position of the consumer. This can be shown in the following diagram.


In this diagram PCC is the Price Consumption Curve. It is sloping downwards to the right. Any point on the Price Consumption Curve will indicate the equilibrium position of the consumer under the Price Effect. In this diagram when the price of X falls, the consumer purchases more of X and less of Y.

Shapes of Price Consumption Curve

With a fall in the price of one commodity there will be some extra income with the consumer. It can distribute this real extra income on the two commodities in different ways. So the Price Consumption Curve will have different shapes. Below we draw the different shapes of the Price Consumption Curve.


In the above diagram PCC is the price consumption curve. It is a horizontal straight line. It indicates that with a fall in the price of X, the consumer purchases more of X and the same quantity of Y


In the above diagram PCC, the price consumption curve, is sloping upwards to the right. This indicates that with a fall in the price of X the consumer purchases more of X and more of Y.

In this diagram the price consumption curve is sloping upwards to the left. This indicates that with a fall in the price of X, the consumer purchases less of X. This is applicable in case of Giffen goods.

Mr. Robert Giffen made a survey in Ireland in the 19th century and found out that the people of Ireland spent major portion of their income on potatoes and meat. He also observed that when there was a rise in the price of potatoes, people purchased more potatoes. Because they did not have sufficient income to purchase sufficient quantity of meat and potatoes. Since potatoes were more essential to them, they purchased more potatoes and less meat. So those commodities, which are purchased more even when there is a rise in the price, they are known as Giffen goods.

Substitution Effect
Income Effect

Indifference Curve Analysis - Income Effect

New equilibrium position under Indifference Curve Analysis

The equilibrium position of the consumer will be found out on the assumption that income of the consumer will remain constant. Now if there is any change either in the income of the consumer or prices of commodities, there will be a change in the equilibrium position.

This can be explained under three heads.

1. Income Effect
2. Price Effect
3. Substitution Effect

1. Income effect: Meaning - Where there is a change in the income of the consumer, but the prices of the commodities remain constant, there will be a change in consumption made by the consumer. This change in consumption is called the Income Effect.

Equilibrium: Under the income effect there will be a change in the equilibrium position of the consumer and that can be shown in the following diagram.


In the diagram AB is the original price line. T1 is the original equilibrium position. As there is increase in income the new price line or the budget line is CD. T2 is the new equilibrium position. When there is further increase in income, EF becomes the new budget or price line. T3 becomes the new equilibrium position. If we now join T1, T2 and T3, it forms a curve known as income-consumption curve(ICC). The ICC shows the new equilibrium position of the consumer, where there is a change in income, with prices remaining constant.

Types of Income Effect: There are two types of income effect.

1. Positive income effect: When with the increase in income, there is increase in consumption, that is known as Positive Income Effect.

2.Negative Income Effect: when with the increase in income there is decrease in consumption, that is known as Negative Income Effect. The negative income effect is applicable in case of inferior goods. Inferior goods are those goods, which are purchased less as one's income rises.

When the consumer purchases less of commodity X as a result of increase in income, X is the inferior commodity. When the consumer purchases less of commodity Y, as a result of increase in income, Y is the inferior commodity.


In both the cases the consumer moves from equilibrium position T1 to the new equilibrium position T3.


Theory of Consumption - Indifference Curve Analysis

The advocates of Indifference Curve Analysis make the following assumptions for the analysis of the behaviour of the consumer.

1. Utility cannot be measured

2. When the consumer is given more of a commodity, he will always prefer to have more to less of that commodity.

3. It is based on the Principle of Transitivity. If there are many combinations of two commodities, and if the consumer is indifferent between the combinations of A and B, and also indifferent between B and C, so he will be indifferent between the combinations of A and C.

4. The Indifference Curve Analysis is based on the Law of Diminishing Marginal Rate of Substitution.


Properties of Indifference Curve

There are definite properties of the Indifference Curve(IC). On these properties is built the shape of the IC.

1. An IC slopes downwards from left to right, because as the consumer increases the consumption of one commodity, he has to decrease the consumption of another commodity in order to remain at the same satisfaction level.

2. The IC cannot touch either the X-axis or the Y-axis, because if the IC touches either of the axes, then the consumer will purchase only one commodity. But this is against the concept of the IC. IC is the representation of the same satisfaction obtained from different combinations of two commodities.


3. The higher IC gives more satisfaction than the lower IC, because in the higher indifference curve the consumer will have more of the commodities. Also, the consumer will always prefer to have more to less of that commodity. In the diagram IC4(highest) gives the maximum satisfaction to the consumer because on this curve the consumer will have more of the commodities.

4. The different indifference curves cannot cut each other at any point. If two ICs cut each other at a point, satisfaction obtained from both the curves will be the same. This is against the property of IC. All the points on a higher indifference curve give more satisfaction than all the points on a lower indifference curve.

5. An indifference curve is convex to the origin because it is based on the law of Diminishing Marginal Rate of Substitution.

Diminishing Marginal Rate of Substitution

Statement of the Law: If there are two commodities, the consumer will substitute one commodity for the other commodity in order to get the same satisfaction, but the marginal rate of substitution will be diminishing.

This can be explained with the following example. Figures are units consumed of commodities X and Y.
Combination A (X=1, Y=15, Substitution=0),
Combination B (X=2, Y=11, Substitution X = 2-1= 1, substitution Y = 15-11 = 4 )
Combination C (X=3, Y= 8, Substitution X = 3-2= 1, substitution Y = 11-8 = 3)
Combination D (X=4, Y= 6, Substitution X = 4-3= 1, substitution Y = 8-6 = 2 )
Combination E (X=5, Y= 5, Substitution X = 5-4= 1, substitution Y = 6-5 = 1 )

Substitution of commodity Y gradually diminishes from 5 to 4 to 3 to 2 to 1.

Diagram of Marginal Rate of Substitution

When the Indifference curve is convex to the origin, the Law of Diminishing Marginal Rate of Substitution will be applicable.

The Indifference curve can never be a straight line or concave to the origin.


Consumer's Equilibrium


Meaning: the consumer will be at an equilibrium position when he gets the maximum satisfaction out of his consumption. At this position he is not willing to make any alterations in his pattern of consumption.
Assumptions: In order to find out the consumer's equilibrium position with the help of IC Analysis, we make the following assumptions.

1. The consumer has an indifference map.
2. The consumer has a fixed amount of income, and he will spend the whole of the income on the goods or commodities, which are available in the market.
3. There are only two commodities available in the market. This is done to keep the discussion simple and easy to comprehend.
4. The prices of these two commodities are fixed.
5. These two commodities are finely divisible.
6. The consumer acts rationally.

Now if we combine the indifference map and the price line, we can find out the consumer's equilibrium position, because the indifference map shows the scale of preferences of the consumer and the price line shows the purchasing power of the consumer.

In the diagram below we combine the indifference map and the price line.


Conclusion: thus according to the Indifference Curve analysis the consumer will be at equilibrium when the price line is tangent to the highest Indifference curve.

New equilibrium position under Indifference curve analysis
The equilibrium position of the consumer will be found out on the assumption that income of the consumer will remain constant. Now if there is any change either in the income of the consumer or prices of commodities, there will be a change in the equilibrium position.

Theory of Consumption - Indifference Curve Analysis - An Overview

Introduction: The ordinalists did not accept the Utility Analysis. They pointed out many defects in the Utility Analysis. Some of the defects are as follows:

1. The Utility Analysis is based on the assumption that utility can be measured. But according to the ordinalists utility cannot be measured.

2. The Utility Analysis is based on the assumption that utility is independent. The utility of one thing does not depend upon the utility of another thing. But according to the ordinalists, utility is not independent. The utility that we get out of a commodity depends on the consumption of another commodity. For example: Pen and ink.

3. The Utility Analysis is based on the assumption that the marginal utility of money remains constant. But according to the ordinalists, the marginal utility of money does not remain constant. When the consumer has more money, the marginal utility of money, that is the utility derived from the last dollar spent, will be less. When the consumer has less money, the marginal utility of money will be more.

In order to overcome these defects the ordinalists introduced the Indifference Curve Analysis. Some of the economists are Mr. Fisher and Mr. Edgeworth. This concept of indifference curve was further expanded during the 1950s by two other economists, Mr. Hicks and Mr. Allen.

Meaning: An indifference curve is the representation of the same satisfaction obtained from different combination of two commodities.

This can be shown in the following table.

Saturday, March 26, 2011

Economics as a Science

The word science comes from the Latin word 'scientia'. But the scientists try to give the definition of science in two ways.

Science is a body of principles which are applicable everywhere in all periods of times, and on the basis of which predictions can be made. If this is the definition of science, then Economics is not a science.

In Economics there are principles of laws, such as the Law of Demand, Law of Supply, Law of Diminishing Utility, Law of Diminishing Returns etc. But the laws of Economics are not applicable everywhere. Moreover, on the basis of these laws no predictions can be made.

Science can also be defined as a systematic knowledge based on either observation or experiment or study and lays down certain principles about the subject, which is observed, experimented or studied. If this be the definition of science, then Economics is a science, because this knowledge is a systematic knowledge. It is based on observation and study. It lays down certain principles or laws.

Science can be classified into two groups:

1. Positive Science: The science, which gives the answer to the question what it is, is known as positive science.

2. Normative science: The science, which gives the answer to the question what is should be, is known as normative science.

Science can be classified into two other groups:

1. Natural science: The science, which deals with nature and natural phenomena, is known as natural science.

2. Social science: The science, which deals with society and the different elements of the society, is known as social science.

Theory of Consumption - Utility Analysis

Assumptions:In the Theory of Consumption we try to analyze the behaviour of the consumer. We try to find out how a consumer tries to satisfy his economic wants. But before we try to analyze his behaviour, we make the following assumptions about the behaviour of the consumer.

1. A consumer has a fixed amount of income.

2. The end of the consumer is to get the maximum satisfaction out of his consumption.

3. The consumer will act rationally.

Techniques: Economists have introduced techniques for the analysis of the behaviour of the consumer.

1. Utility Analysis
2. Indifference Curve Analysis
3. Revealed Preference Analysis

1. Utility Analysis

Introduction: The Utility Analysis was introduced by Mr. Alfred Marshall in 1890, when he published his book "The Principles of Economics."

Meaning of Utility: The aim of man is to satisfy his economic wants. So he uses the goods and services. Thus anything that has the power to satisfy the economic wants of man is said to possess utility.

Measurement of Utility: There are two different opinions among the economists for the measurement of utility.

According to one group of economists it is possible to measure the utility by the amount of money that one spends for the commodity. These economists are known as the Cardinalists.

According to another group of economists it is not possible to measure the utility because utility is abstract. These economists are known as the Ordinalists.

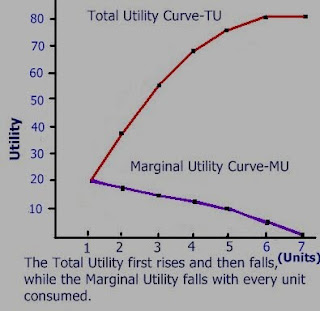
Law of diminishing Utility: If we increase the consumption of a particular commodity, the total utility will increase up to a certain point at a diminishing rate, and the marginal utility will decrease. Marginal utility is the utility derived from the last unit of the commodity consumed.


On the basis of the above table, we can draw the following diagram to explain the Law.


For a hungry person the utility of the first apple is quite high. But after eating the first apple, he may feel even more hungry. So the second apple fetches even higher utility. Thus utility, derived from the second apple eaten, increases. Total utility here is the sum total of utility derived from the first as well as the second apple. After eating the third apple he may start feeling less hungry. So the third apple fetches lesser utility than the second. Thus, marginal utility, that is the utility derived from the last apple consumed, starts diminishing. The fourth apple fetches even less. This way marginal utility keeps on diminishing. Hence the Law of Diminishing Utility. However, the total utility keeps on increasing, though at a diminishing rate.

Consumer Equilibrium: Meaning: The aim of the consumer is to satisfy his economic wants. The position where the consumer gets the maximum satisfaction out of his total consumption is said to be the consumer's equilibrium position. At this position, the consumer is so satisfied that he is not willing to make any alterations in his pattern of consumption.
Law of Equimarginal Utility: In order to find out the consumer's equilibrium position Mr. Marshall has introduced the Law of Equimarginal Utility. It is also known as the Law of Substitution. It is also known as the Law of Maximum Satisfaction.

Assumptions of the law: In order to find out the consumer's equilibrium position with the help of the Law of Equimarginal Utility, we make the following assumptions.

1. The consumer has a fixed amount of income and he will spend the whole income on the commodities, which are available in the market.

2. There are only two commodities, namely X and Y, available in the market.

3. These two commodities are finely divisible.

4. The consumer acts rationally.

Statement of the law: According to the Law of Equimarginal Utility, the consumer will be at equilibrium when the marginal utility of money spent on one commodity is equal to the marginal utility of money spent on another commodity. In order to find out this, Mr. Marshall has introduced the following formula:

Marginal utility of X /Price of X = Marginal utility of Y/Price of Y

When these two are equal, the consumer is said to be in an equilibrium position.

Subject matter of Economics

There are two approaches to the study of the subject matter of economics.

1. Traditional Approach 2. Modern approach

1. Traditional Approach: The traditional approach was introduced by classical economists. Classical means something, which has been followed for a long period of time. It functions as the basis from which new ideas are developed. It must have its originality. The ideas of classical economists are the basis of modern economic theories.

According to the traditional approach, economics deals with man. Yet economics does not deal with the body or the mind of man. Economics deals with the activities of man. Economics deals only with those activities of man through which man tries to satisfy his economic wants. There are three fundamental economic wants.

a) Food
b) Clothing
c) Shelter

In order to satisfy the economic wants man uses goods and services. This is known as consumption in economics. In the
Theory of Consumption we try to analyze the behaviour of the consumer.
For the purpose of consumption, there is a need for production. In the
Theory of Production we try to analyze the behaviour of the producer. We try to find out how the producer will allocate his resources so as to get the maximum profit out of his production.
For the purpose of production, we must take the help of the factors of production. There are
four factors of production, such as land, labour, capital and organization. When we try to study the distribution of the national income among the factors of production, it is called distribution in Economics.
In the
Theory of Distribution, we try to analyze the principle of distribution of national income. In course of time man has specialized in different economic activities. Because of this specialization, the exchange system has developed in the society.
In the
Theory of Exchange we study the different problems of exchange.

With the development of state, state is helping man in the satisfaction of economic wants. A branch of Economics deals only with the income and expenditure of the state. This is known as
Public Finance.

In the
Theory of Public Finance we try to analyze the different sources of income of the government. We also try to analyze how the government spends its income. Thus according to the traditional approach the subject matter of economics can be divided into five parts.

1. Consumption
2. Production
3. Distribution
4. Exchange
5. Public Finance

2. Modern Approach: according to modern approach of economics the subject matter of Economics can be divided into

a) Micro Economics b) Macro Economics

a) When we study the problem of Economics from a particular point of view, such as one individual consumer, one firm, the price of one commodity, that is known as
Micro Economics.

b) When we study the problem as a whole, all consumers, all commodities and all producers, it is known as
Macro Economics.

You may also wish to visit my drawing, painting, spirituality and philosophy blog TARRY A LITTLE at http://thewisefinch.blogspot.com


If you want me to write a post on any subject matter of Economics, you may suggest it through your comment.

Friday, March 25, 2011

Definition of Economics

If we want to define anything we must find out the class and group to which it belongs. Then we shall find out its distinguishing quality.

It is very difficult to give a definition of economics. Because economists are not of the same opinion as to the class to which it belongs and a special quality possessed by economics. As a result of this, in different periods of time, different definitions have been given about economics.

Examples of definitions of economics.

1. Adam Smith - 1776

In 1776 Mr. Adam Smith published his book, "An Enquiry into the Causes of Nations", and tried to give a definition of economics as a "Science of Wealth".

An object may be regarded as wealth if it possesses the following qualities.

a) Utility
b) Scarcity
c) Externality
d) Transferability

2) In 1890 Mr. Alfred Marshall published his book "Principles of Economics" and in this book he gave the definition of economics as,

"The study of mankind in the ordinary business of life."

According to Mr. Marshall economics deals only with those activities of man, which can be regarded as business activities. Economics does not deal either with the body or the mind of man.

3) Lionel Robbins - 1931

In 1931 Mr. Robbins published his book "The Nature and Significance of Economic Science".

In this book he defined economics as "a science, which deals with human behaviour as a relationship between ends and scarce means which have alternative uses."

If we analyze this definition we can point out the following features of economics.

1. Science : According to Mr. Robbins, economics is a science because the knowledge of economics is a systematic knowledge.

2. Human behaviour : This science of economics deals with the behaviour of man. In other words, it deals with the activities of man.

3. Ends : Economics deals only with those activities of man through which man tries to satisfy his economic wants.

The three fundamental economic wants of man are

a) Food
b) Clothing
c) Shelter

4. Means : In order to satisfy the economic wants, man uses the means available in the society. But these means are scarce. They are limited in supply.

From the above we find out that the fundamental ends of human activities is the satisfaction of economic wants.

5. Alternative uses : The means by which man tries to satisfy his economic wants are not only limited in supply but also have alternative uses.
Because of the alternative uses, there is a need of choice. Man must make the choice of the best use of the available resources. Hence choice is one of the fundamental problems of economics.

Criticism of Mr. Lionel Robbins' definition

This definition has been criticized by many modern economists on the following grounds.

1. According to Mr. Robbins, economics is a science. But according to the critics economics cannot be regarded only as a science. Because in that case we shall be missing the human touch that exists in economics.

2. According to Mr. Robbins economics deals with the problem of choice. But according to the critics every choice made by man cannot come within the scope of economics. The choice must have an effect on the society of man.

3. According to Mr. Robbins economics deals with the problem of scarcity. But according to the critics all the problems of economics are not the problems of scarcity.

4. The definition of economics does not include the other aspects of economics, such as welfare of man, determination of employment and income in the society and the stability and growth of the economy.

Conclusion : Though there are some criticisms against this definition, this definition is one of the most popular definitions of economics. Even today many economists are trying to define economics along the line of scarcity. Even Mr. Samuelson has also defined economics on the line of Mr. Robbins.
Update(s):Post(s) under preparation: -
_______________________________________
View Chandra Bhanu's Art at Profoundfeeling.blogspot.com

LinkWithin

Related Posts Plugin for WordPress, Blogger...

Labels

indifference curve investment demand-pull inflation economy fiscal policy monetary policy cost-push inflation demand demand for money destabilized economy economics stagflation supply of money Opportunity Cost Quantity Theory of Money Theory of Consumption World economy automatic stabilizer capital choice consumption function current accounts deficit deflationary gap demand for investment depression derivation effects of inflation equilibrium fiscal deficit fresh investment growth imbalance inflation interest money perfect competition savings savings function world Accounting Profit Adam Smith Alfred Marshall Diminishing Marginal Utility Economic Profit Equimarginal Utility General Equilibrium Theory IS Curve J. M. Keynes Keynes' Theory of employment LM Curve Lionel Robbins Normal Profit PPC Production Possibility curve Software system development Utility Analysis accelerator account accounting alternative uses autonomous investment balance of payments book keeping capital goods classical theory of the rate of interest commodity consumer consumer goods consumption credit debit definition deflation discretionary double entry economic functions economic wants educated education ends energy ermployment full employment functions of money growth rate habit imitation imperfect competition income income analysis income determination income effect induced investment inflationary gap investment function knowledge labour less than full employment liquidity preference theory long run long run equilibrium means monetary analysis monetary measures monopoly multiplier price price effect price maker production possibility frontier profit maximization propensity revealed preference analysis sacrifice say's Law scarce science shifts of IS LM curves short run short run equilibrium shut down conditions slow down society stagnation student subsidies subsidy substitution effect success sunk capital supply supply of savings technology unproductive wealth world economy 2012